1/ It Is OK to Be Bullish The S&P 500, But Not The Market of Stocks |
2/ Breadth and Rates Are Linked |
3/ Small Caps Testing Support but Are Not Yet Oversold |
4/ New Highs Coming for USD/JPY? |
5/ Europe Consolidating to Trend Support |
|
|
Investopedia is partnering with CMT Association on this newsletter. The contents of this newsletter are for informational and educational purposes only, however, and do not constitute investing advice. The guest authors, which may sell research to investors, and may trade or hold positions in securities mentioned herein do not represent the views of CMT Association or Investopedia. Please consult a financial advisor for investment recommendations and services. |
| |
It Is OK to Be Bullish The S&P 500, But Not The Market of Stocks |
Courtesy of John Kolovos, CMT, CFA & Bloomberg |
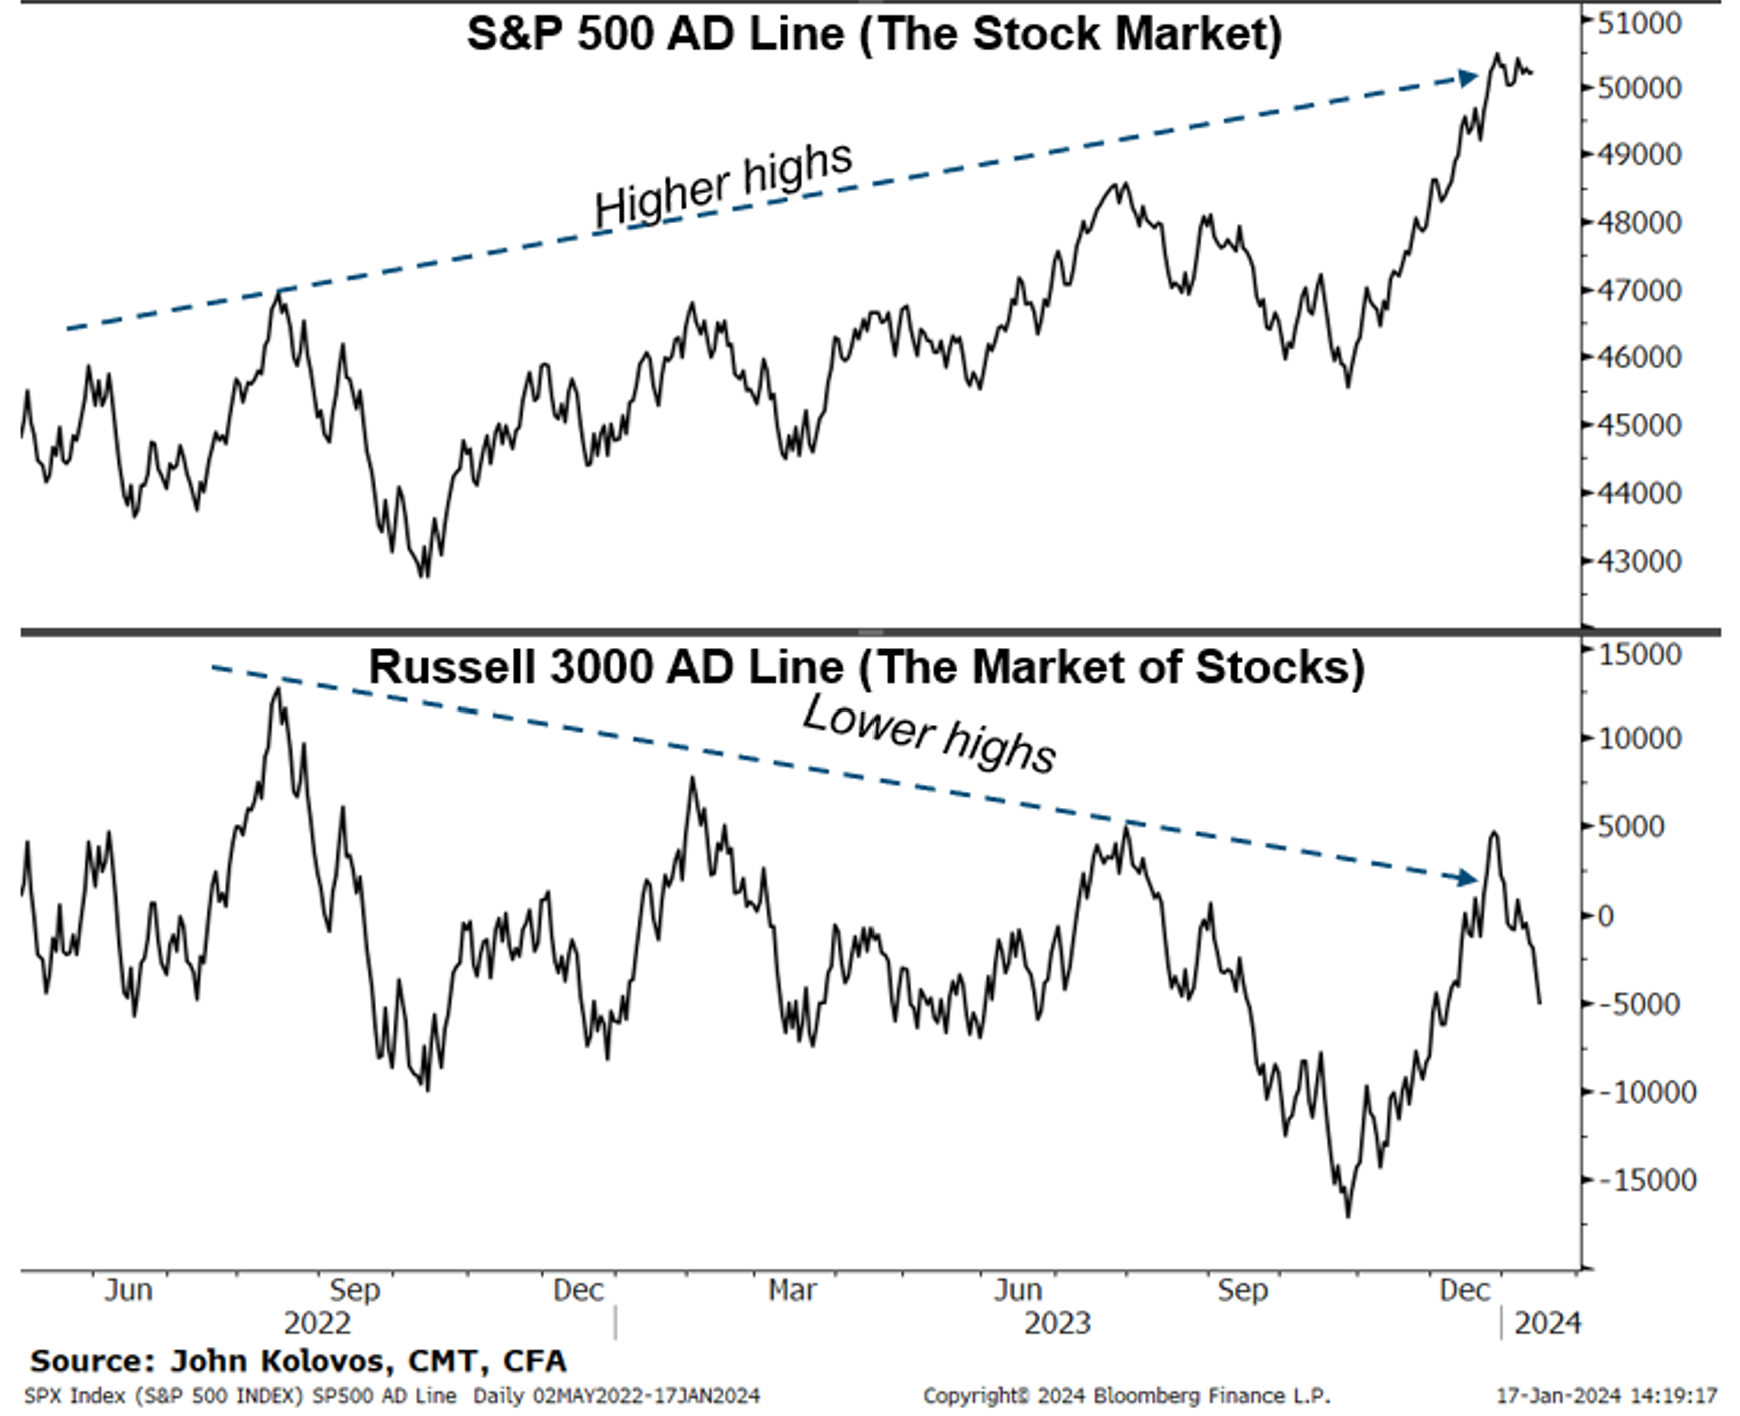
Déjà vu all over again. Party like it's 2023! Breadth is weakening again for the broad market, and it seems like we are heading back into the have’s vs the have-nots; mega-cap growth vs everything else. The Mag 7 vs the S&P 493. A big part of our market view last year was that it was OK to be bullish on the stock market (S&P 500) but not the market of stocks (Russell 3000). In fact, there was nothing really wrong with the S&P 500 last year, which carved out its bear market bottom in October ’21, and put in place a series of higher highs and higher lows after that. The uptrend was confirmed by the Advance-Decline Line, which recently made a new high. However, the broader equity complex remains longer-term challenged, as shown by the R3K AD Line. Notice the higher highs in the S&P 500’s AD Line, whereas the Russell 3000 has lower highs. This divergence does not have to be bearish per se, but it does mean being selective and tactical in stock selection/portfolio construction while making advances above and beyond ATHs on SPX vulnerable to idiosyncratic risk. |
|
|
Financial market research from professionals at the forefront of technical analysis innovation. |
| |
Breadth and Rates Are Linked |
Courtesy of John Kolovos, CMT, CFA & Bloomberg |
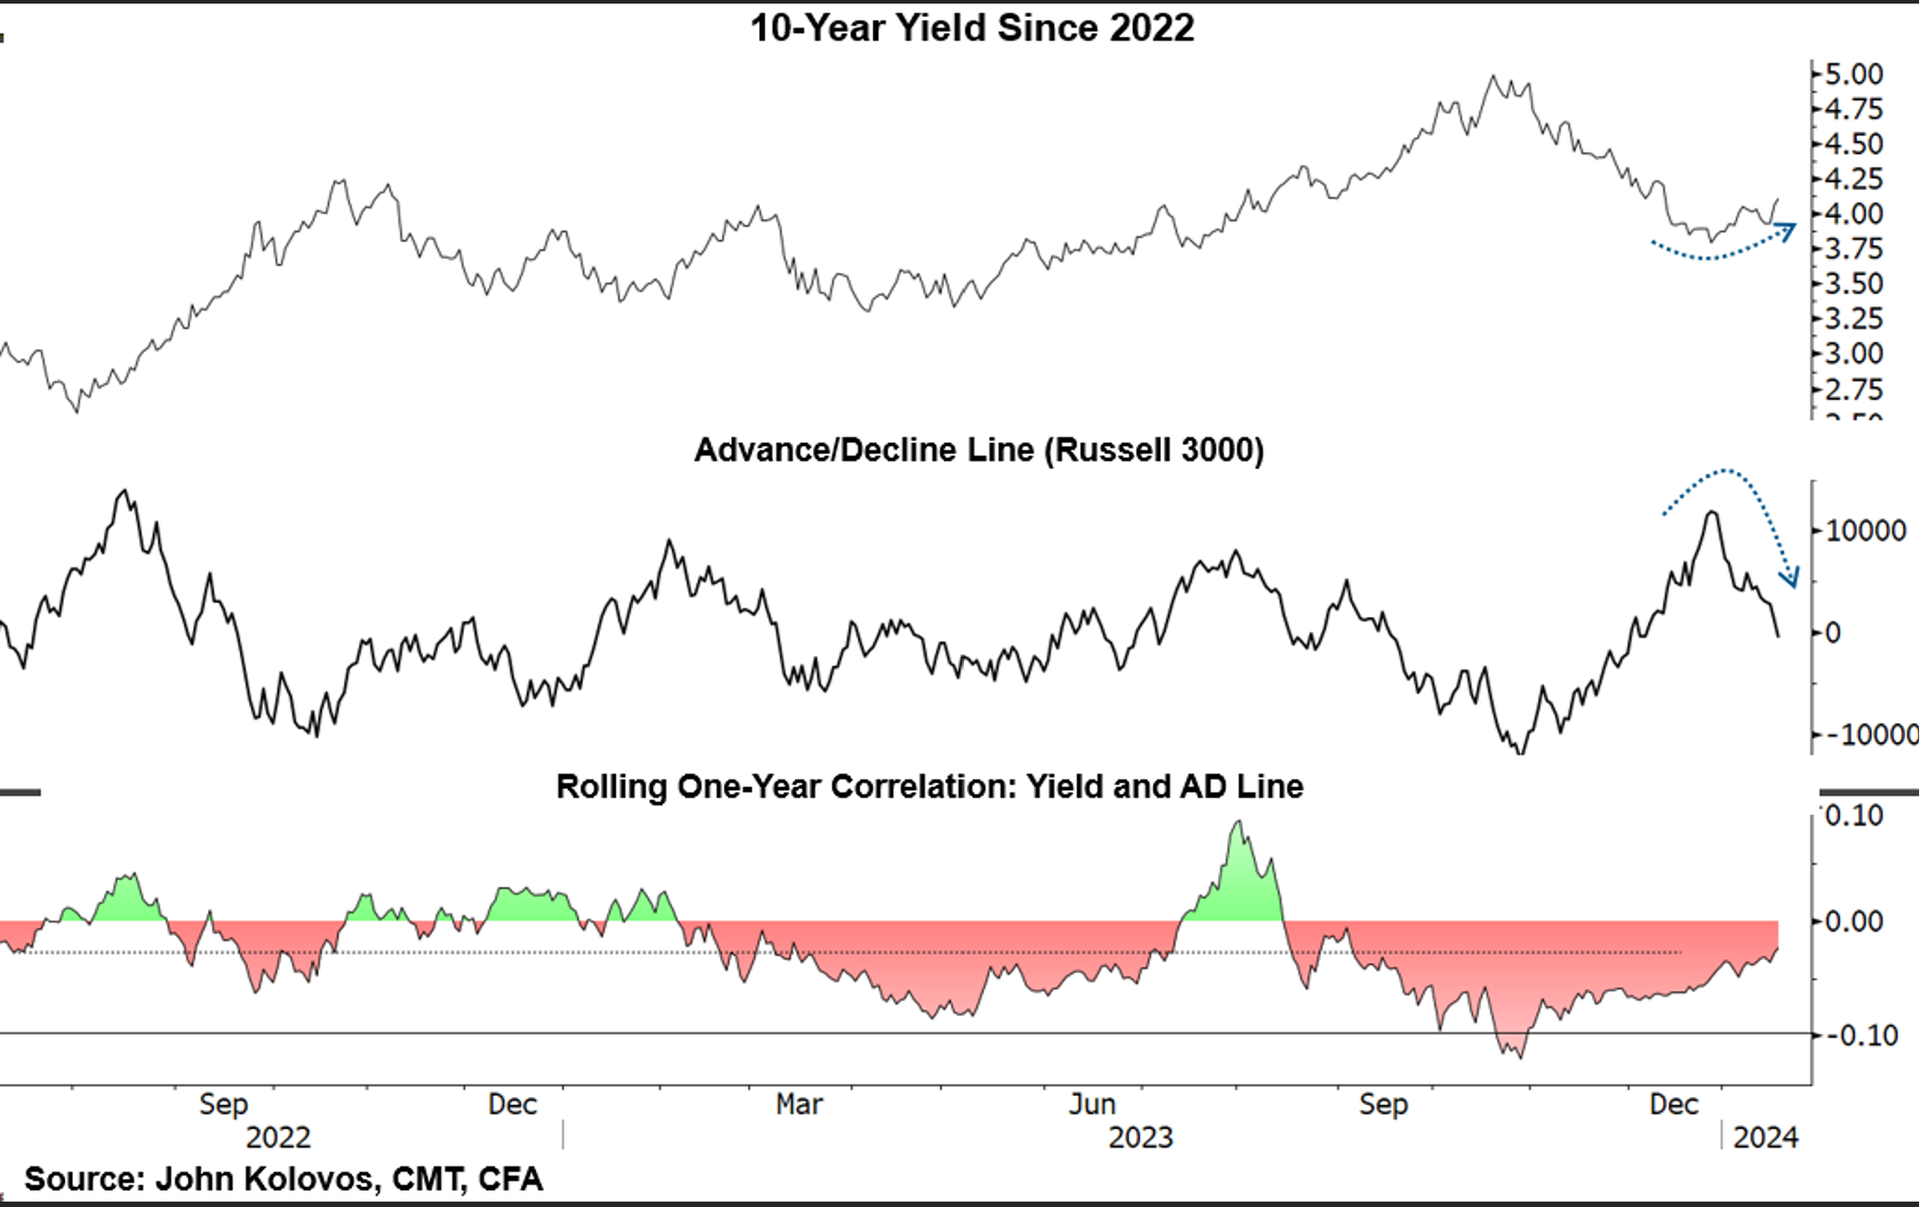
We are being reminded again as we were for all of 2023, that interest rates and breadth are inversely related. Chart 2 shows the rolling correlation between the US 10-year Yield and the Russell 3000 AD Line. The broadening of the equity market in Q4 was based on a major Fed pivot that now appears to be in the process of being reevaluated. In turn, yields have bounced, and breadth has weakened. Safety is being sought at the mega-cap growth complex, and risk is being reduced in the part of the market that is most sensitive to inflation, rates, and a recession. |
|
|
Small Caps Testing Support but Are Not Yet Oversold |
Courtesy of John Kolovos, CMT, CFA & Bloomberg |
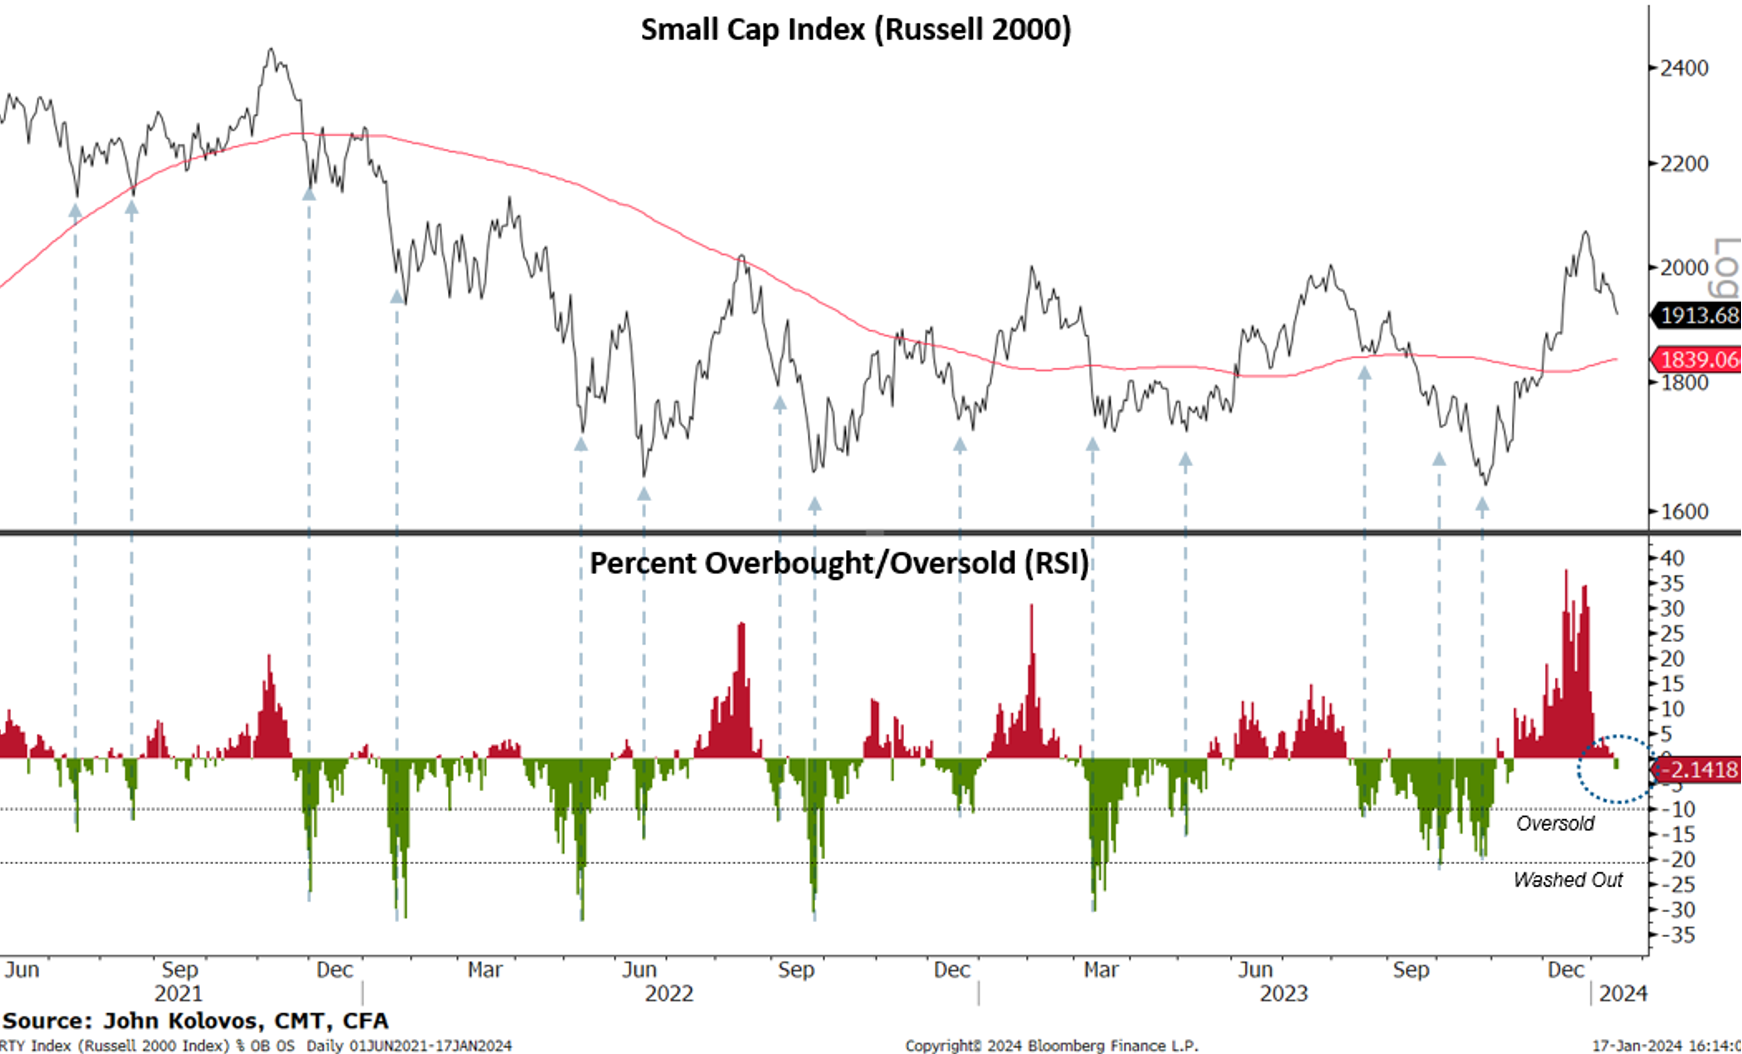
Small caps have taken the brunt of the abuse thus far in 2024, with a 9% drawdown since December 27th compared to 1.8% for the S&P 500. In yesterday’s Chart Advisor, we said that parabolic moves do not correct by going sideways, so the decline in the Russell 2000 is not too surprising and that support “should” kick in above $185, which is the 50 DMA and the 38.2% retracement of the October’23 advance on IWM. What is interesting to note is that the 10-year yield is testing resistance at its 50 DMA, but the percentage of stocks in the Russell 2000 that are oversold is not at levels consistent with a recovery. Just 5% have an RSI < 30. Historically, readings in excess are deemed oversold. |
| |
New Highs Coming for USD/JPY? |
Courtesy of John Kolovos, CMT, CFA & Bloomberg |
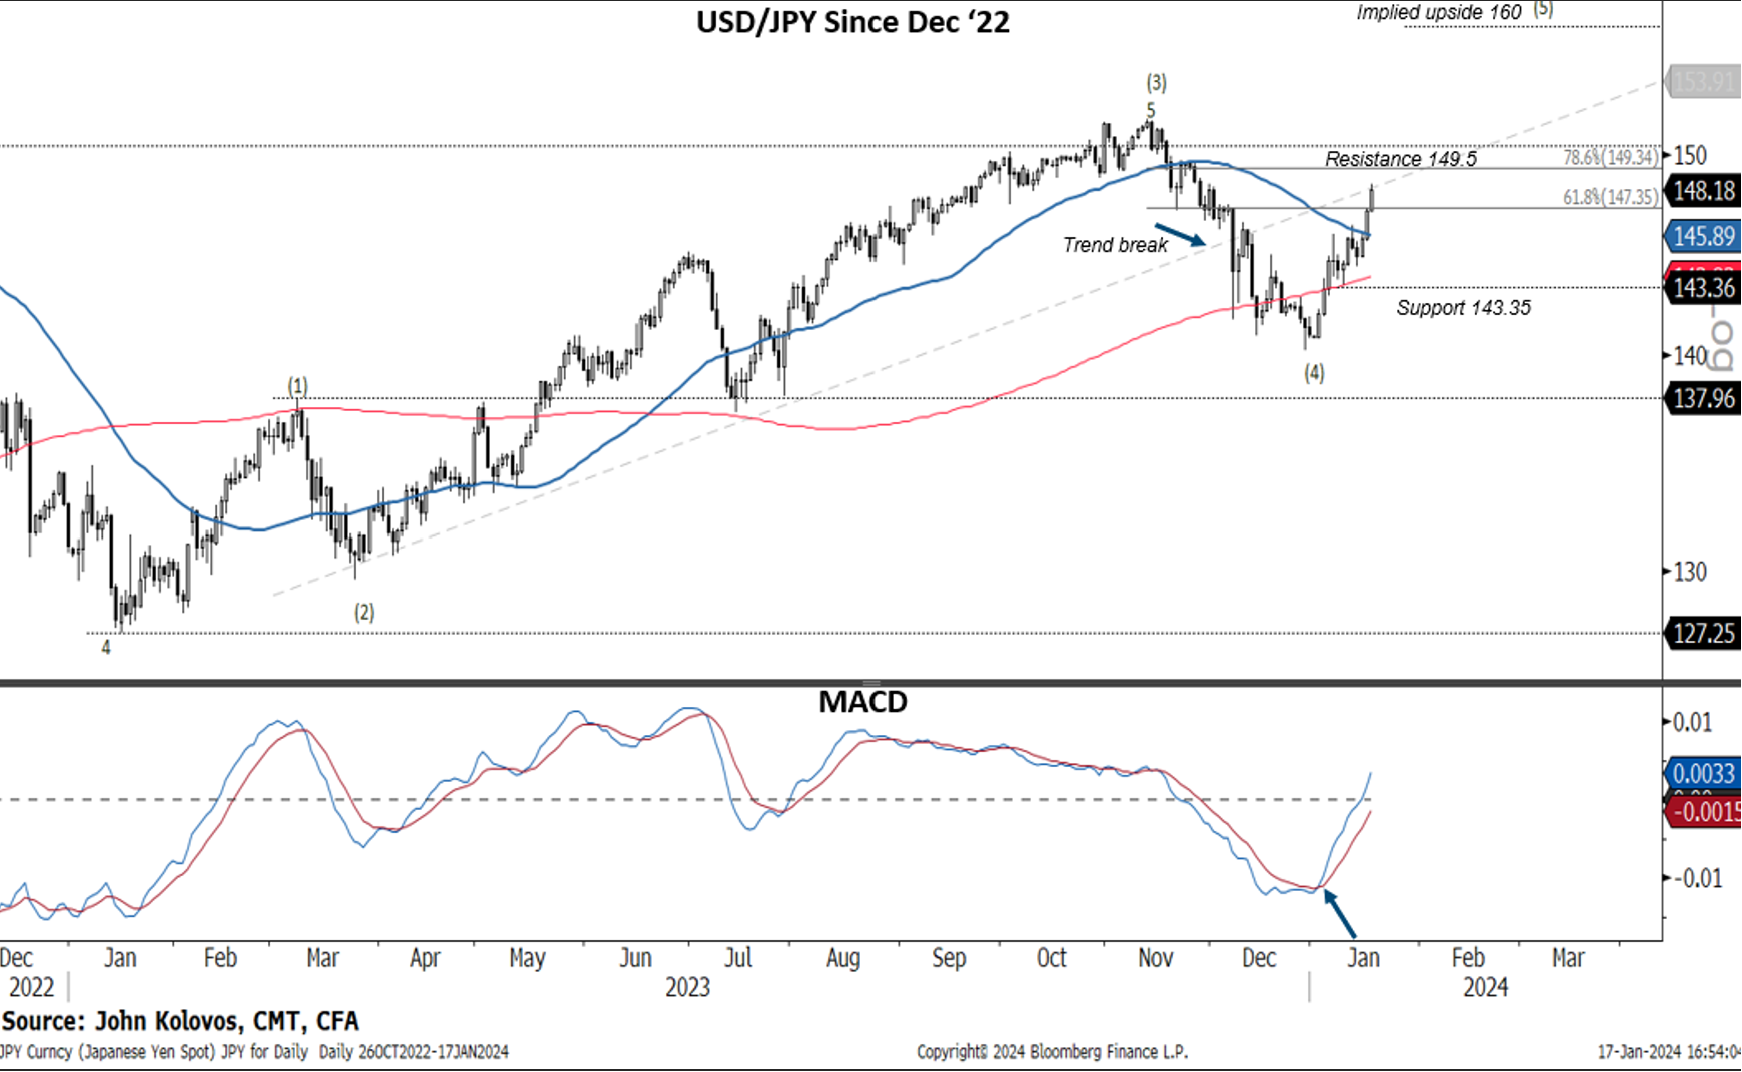
A chart standout this year has been the acceleration higher from USD/JPY. The yen reached its weakest level in six weeks versus the dollar, while government bonds fell, and the US 10-year built value above 4%. The chart of USD/JPY shows a moderating uptrend, but from an Elliot Wave perspective, it is tracking a move to the 160 area. Worries about intervention and speculation of BOJ rate hikes may reduce the speed of JPY’s decline vs. the dollar, which is why we must see how strong resistance at the 149.50 area is treated in the coming weeks. If USD/JPY is approaching resistance, along with the US 10-Year Yield, then we should look for risk sentiment to improve. Let’s see. |
| |
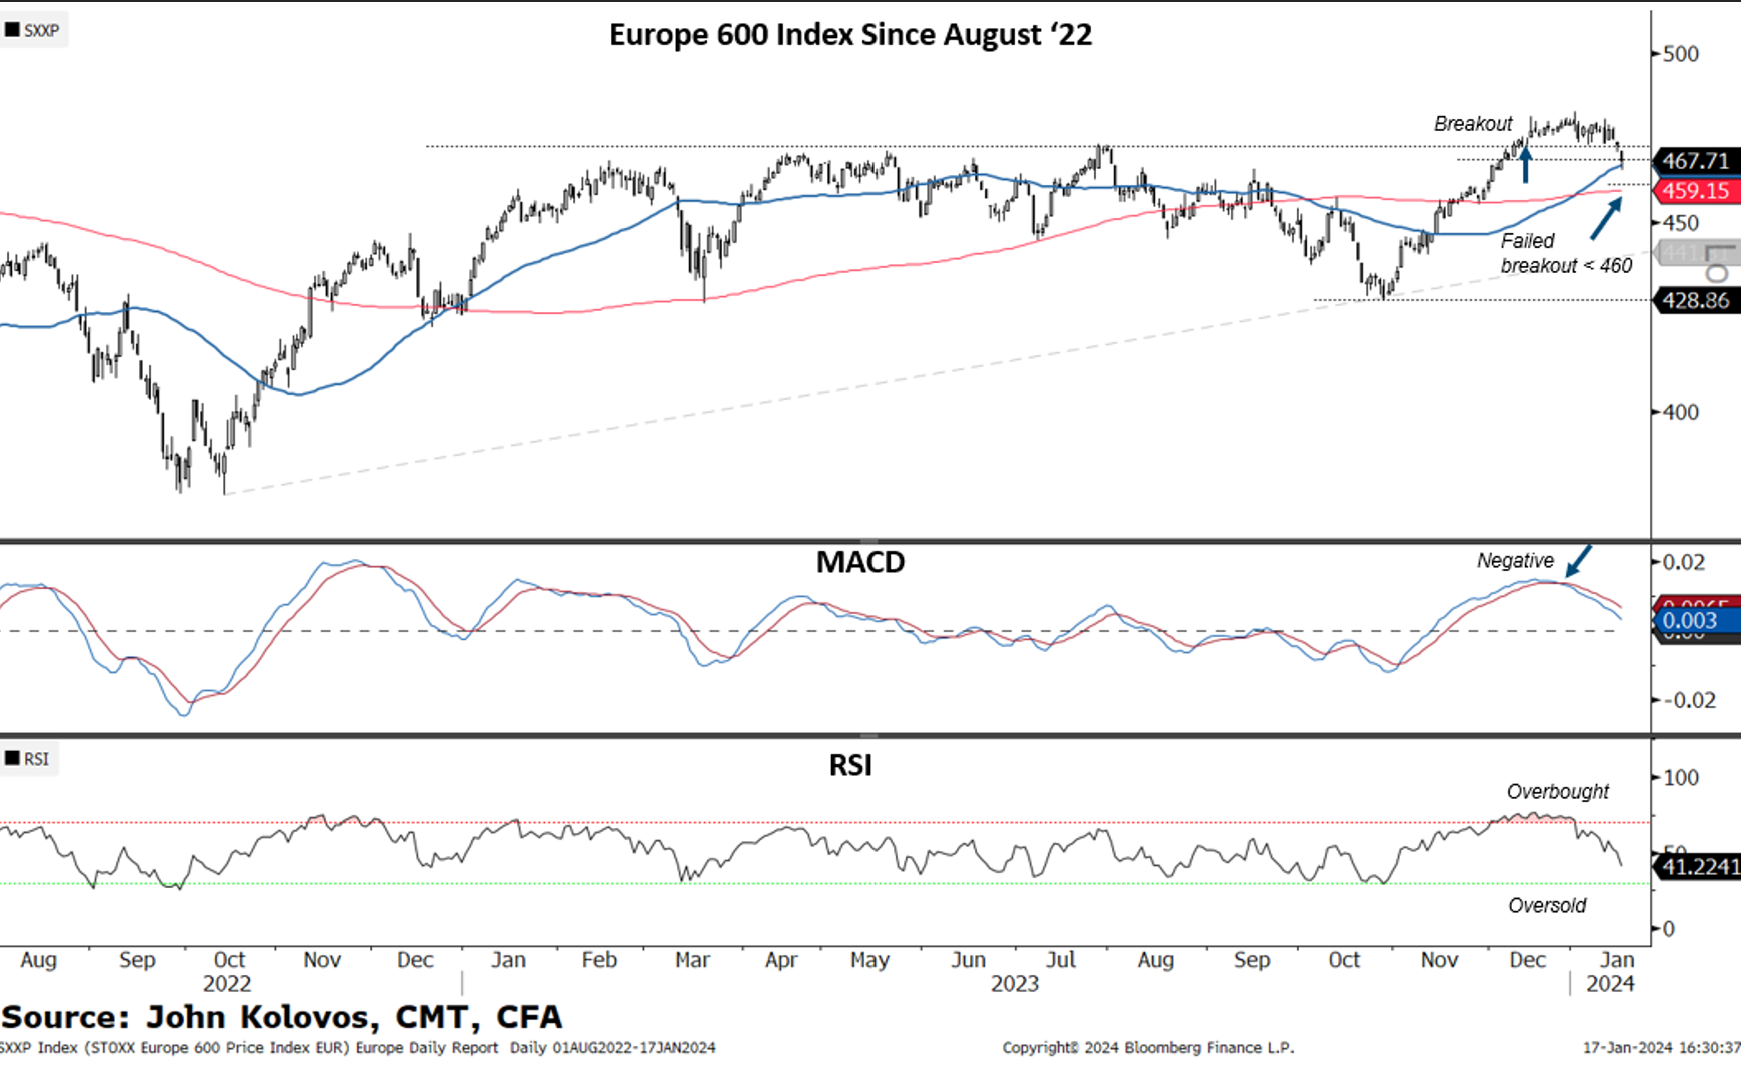
Europe Consolidating to Trend Support |
Courtesy of John Kolovos, CMT, CFA & Bloomberg |
The majority of the outliers on Wednesday, January 16th, were from overseas markets. Korea added to a disastrous month, down 2.5%. India, down over 2% on the heels of disappointing HDFC results, and fell over 8%. The Shanghai Composite was down over 2% to a multi-year low. FTSE 100 (UK) was down 1.5% or a -2.5 STDEV decline and sliced right through the 7500 support, still rangebound/tilted lower. As the chart shows, The Europe 600 Index touched 50 DMA support after a 1.2% decline, the worst day since October. The reversal of higher interest rates has forced a reset in global markets, too. Not only has breadth weakened in the US (see above comments), but global participation is wavering too. |
| |
John Kolovos, CFA, CMT is Head of Technical Strategy at Macro Risk Advisors. In this role, John is responsible for delivering high-conviction investment insights for institutional cleints, identifying tactical trading opportunities, and analyzing cross-asset relationships between stocks, commodities, currencies, and interest rates from across the globe. John has been one of Wall Street’s most sought-after macro-based analysts for over 20 years, and is a frequent guest on CNBC and Bloomberg TV and is widely quoted in the financial press. John is also an adjunct professor at Brandies University, where he teaches a graduate-level course on Technical Analysis and is very active in the technical analysis community by serving on the executive committee as Vice-President for the Charted Market Technicians Association (CMT) as well as sitting on the Governance committee. |
|
|
You are receiving this newsletter because you subscribed to the Chart Advisor newsletter. If you wish to unsubscribe, please click here. Dotdash Meredith 225 Liberty St, 4th Floor, New York, NY 10281
© 2025 All Rights Reserved. Privacy Policy | Terms of Service |
|
|
|