2/ What to Make of Natural Gas |
3/ Defensive Sectors Ex. Utilities |
|
|
Investopedia is partnering with CMT Association on this newsletter. The contents of this newsletter are for informational and educational purposes only, however, and do not constitute investing advice. The guest authors, which may sell research to investors, and may trade or hold positions in securities mentioned herein do not represent the views of CMT Association or Investopedia. Please consult a financial advisor for investment recommendations and services. |
|
|
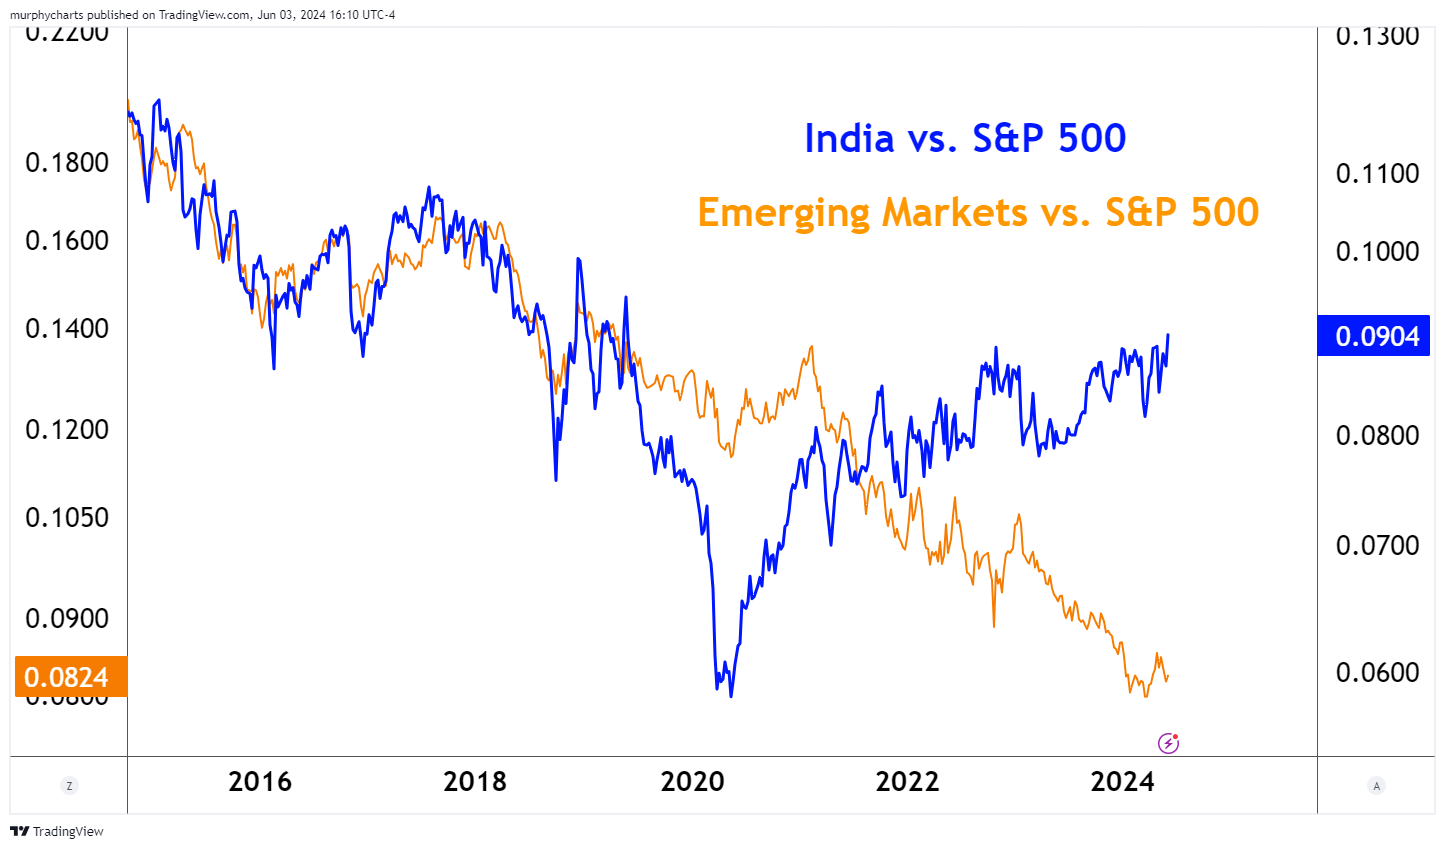
Emerging market equity primarily consists of companies from China, India, and Taiwan. Using the MSCI Emerging Markets Index as a proxy, the 3 countries account for over 60% of the asset class. Post COVID, emerging markets have greatly underperformed the US stock market – this is primarily due to the bear market in China equity. However, the bear market in China is not spilling over to its neighboring market, India. The India stock market (priced in USD) continues to reach new highs on both an absolute basis and relative to US stocks. |
|
|
Financial market research from professionals at the forefront of technical analysis innovation. |
| |
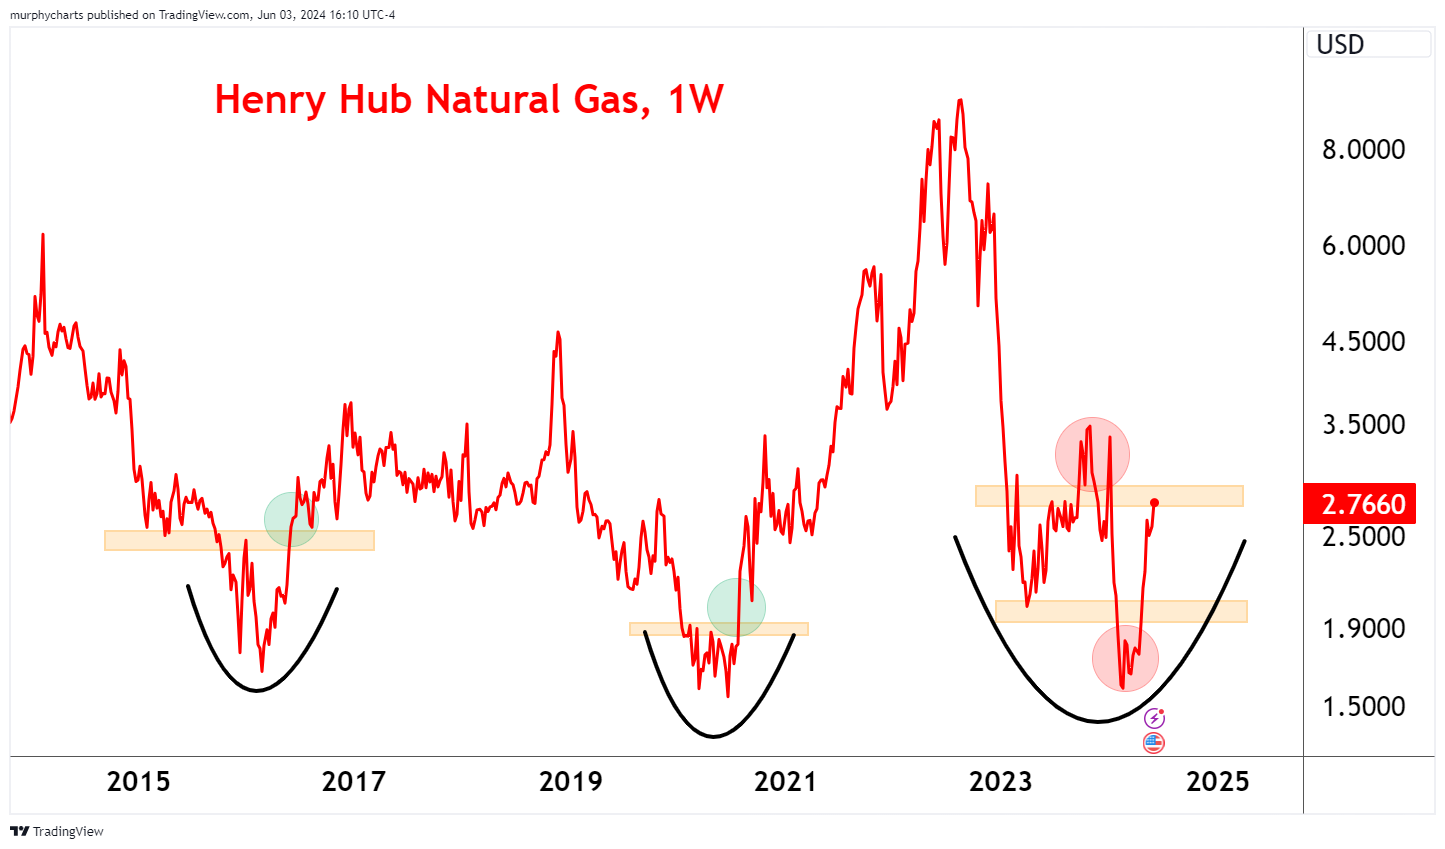
What to Make of Natural Gas |
In just 8-months, Natural Gas witnessed both a failed breakout and failed breakdown on its price chart. It doesn’t get more frustrating than this for trend followers! By all definitions of trend, Natural Gas finds itself in a well-established downtrend. We saw price print lower lows in February and as of today, price remains below the October 2023 highs. |
There are derivative indicators out there suggesting a change of trend is underway, such as the slope of the 200-day moving average turning positive. But price remains objectively in a downtrend. In my opinion, until we see Natural Gas trade above the October 2023 highs, there isn’t much to get excited about. |
|
|
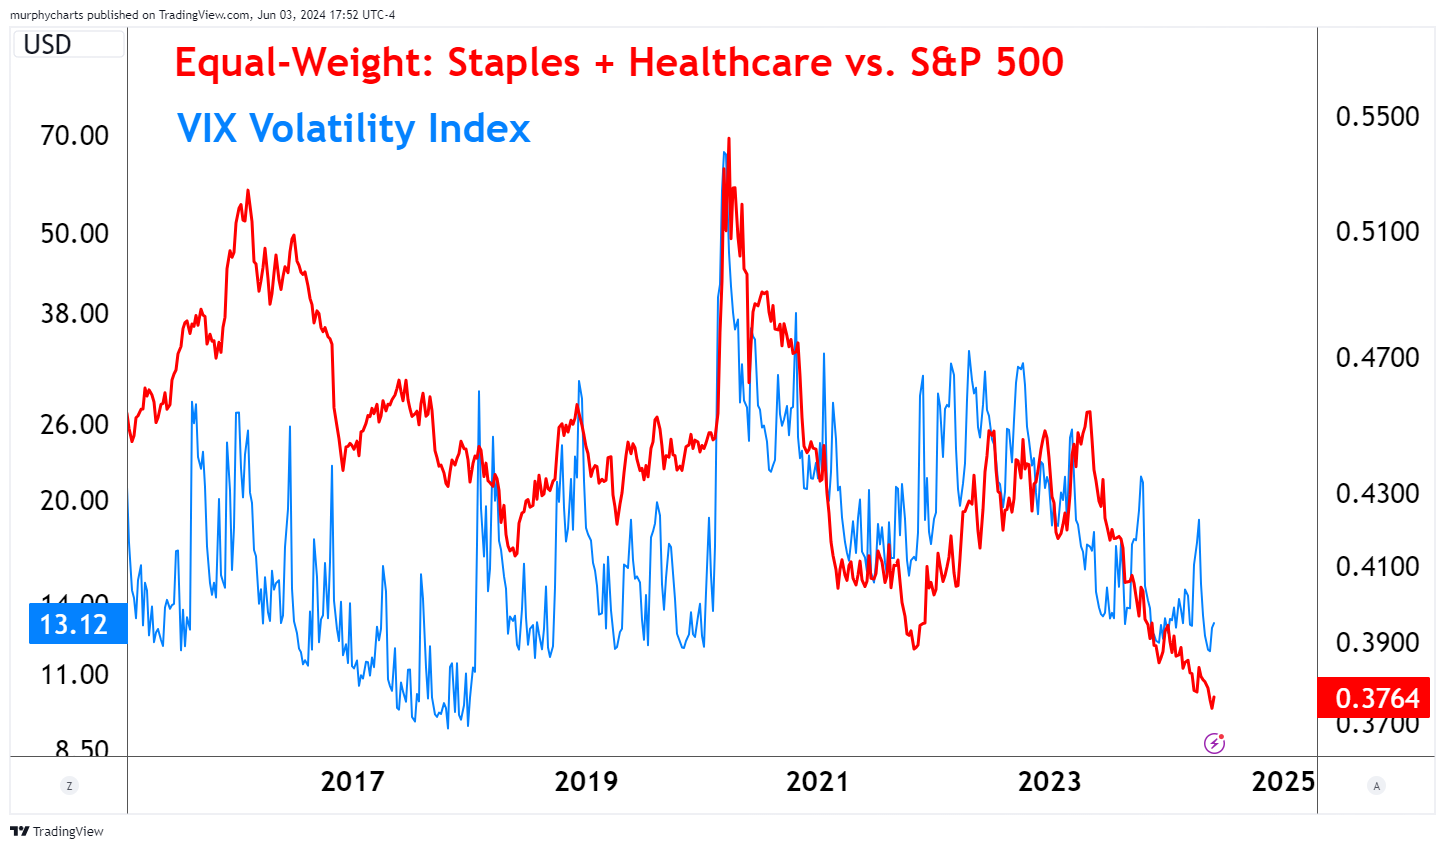
Defensive Sectors Ex. Utilities |
Large-cap Utilities have been on absolute tear in 2024 – but this doesn’t mean investors are risk-off or that defensive sectors in aggregate are set to outperform. We’ve witnessed periods through history where bond proxy Utilities are outperforming on a relative basis, but the broad market treks to new highs. To gain a better understanding we need to strip away Utilities and look at Consumer Staples and Healthcare. The below chart blends the equal-weight sector indices of Utilities and Healthcare and compares it to the broad market. I overlayed the VIX volatility index to highlight the response of defensive sectors when market vol spikes. |
It’s clear, the relative strength chart is displaying zero improvement from a year ago. The recent uptick in defensive sector performance can be attributed to Utilities and not much else! |
|
|
Shane Murphy, CMT has been a CMT Charterholder since 2022. He is currently a Wealth Management Associate at Michael Roberts Associates, Inc. where he assists in portfolio construction, investment research, and financial planning. Learn more at www.mraplanners.com or check Shane out on twitter @murphycharts. |
|
|
You are receiving this newsletter because you subscribed to the Chart Advisor newsletter. If you wish to unsubscribe, please click here. Dotdash Meredith 225 Liberty St, 4th Floor, New York, NY 10281
© 2025 All Rights Reserved. Privacy Policy | Terms of Service |
|
|
|