1/ A Consolidation Through Time and Not Price for the S&P 500 |
2/ Four-Week New Lows Are Expanding for the Market of Stocks |
3/ Parabolic Moves Do Not Correct Sideways | 4/ A Counter-Trend Bounce for the 10-Year Yield |
5/ A Steeper Yield Curve is Weighing on Risk Sentiment |
6/ Recent Sector Correlations to Yield Curve |
|
|
Investopedia is partnering with CMT Association on this newsletter. The contents of this newsletter are for informational and educational purposes only, however, and do not constitute investing advice. The guest authors, which may sell research to investors, and may trade or hold positions in securities mentioned herein do not represent the views of CMT Association or Investopedia. Please consult a financial advisor for investment recommendations and services. |
|
|
A Consolidation Through Time and Not Price for the S&P 500 |
Courtesy of John Kolovos, CMT, CFA & Bloomberg |
Our view has been that January's pullback in the S&P 500 or the “stock market” is consistent with how good overbought conditions typically resolve and have inflicted little damage to the prevailing uptrend. Overbought conditions can be resolved in one of two ways: through a decline in price, often a 1/3 – 2/3 retracement of the preceding move higher, or through the passage of time via sideways trading. Hesitation under all-time high resistance shouldn’t be too surprising, especially as the market looks for confirmation of a Fed pivot as well as earnings season. Based purely on the chart itself (see chart 1), one can’t get too worried on this side of 4700 support or even 4600. In order to remove our +5,000 upside objective, a 43-handle will be needed, and it is way too soon to entertain that. But as we experienced over the past two years, there is a big difference between the “stock market” and the “market of stocks,” which is influenced by the macro environment. |
|
|
Financial market research from professionals at the forefront of technical analysis innovation. |
| |
Four-Week New Lows Are Expanding for the Market of Stocks |
Courtesy of John Kolovos, CMT, CFA & Bloomberg |
While the “stock market” consolidates through time, the “market of stocks” does not. As chart 2 shows, the percentage of four-week lows has expanded to approx. 40% for the Russell 3000 Index (see chart 3). This is an elevated reading, considering that the index is not at a four-week low and is the weakest reading since October. Bottom line, the S&P 500 is masking weakness beneath the surface. |
|
|
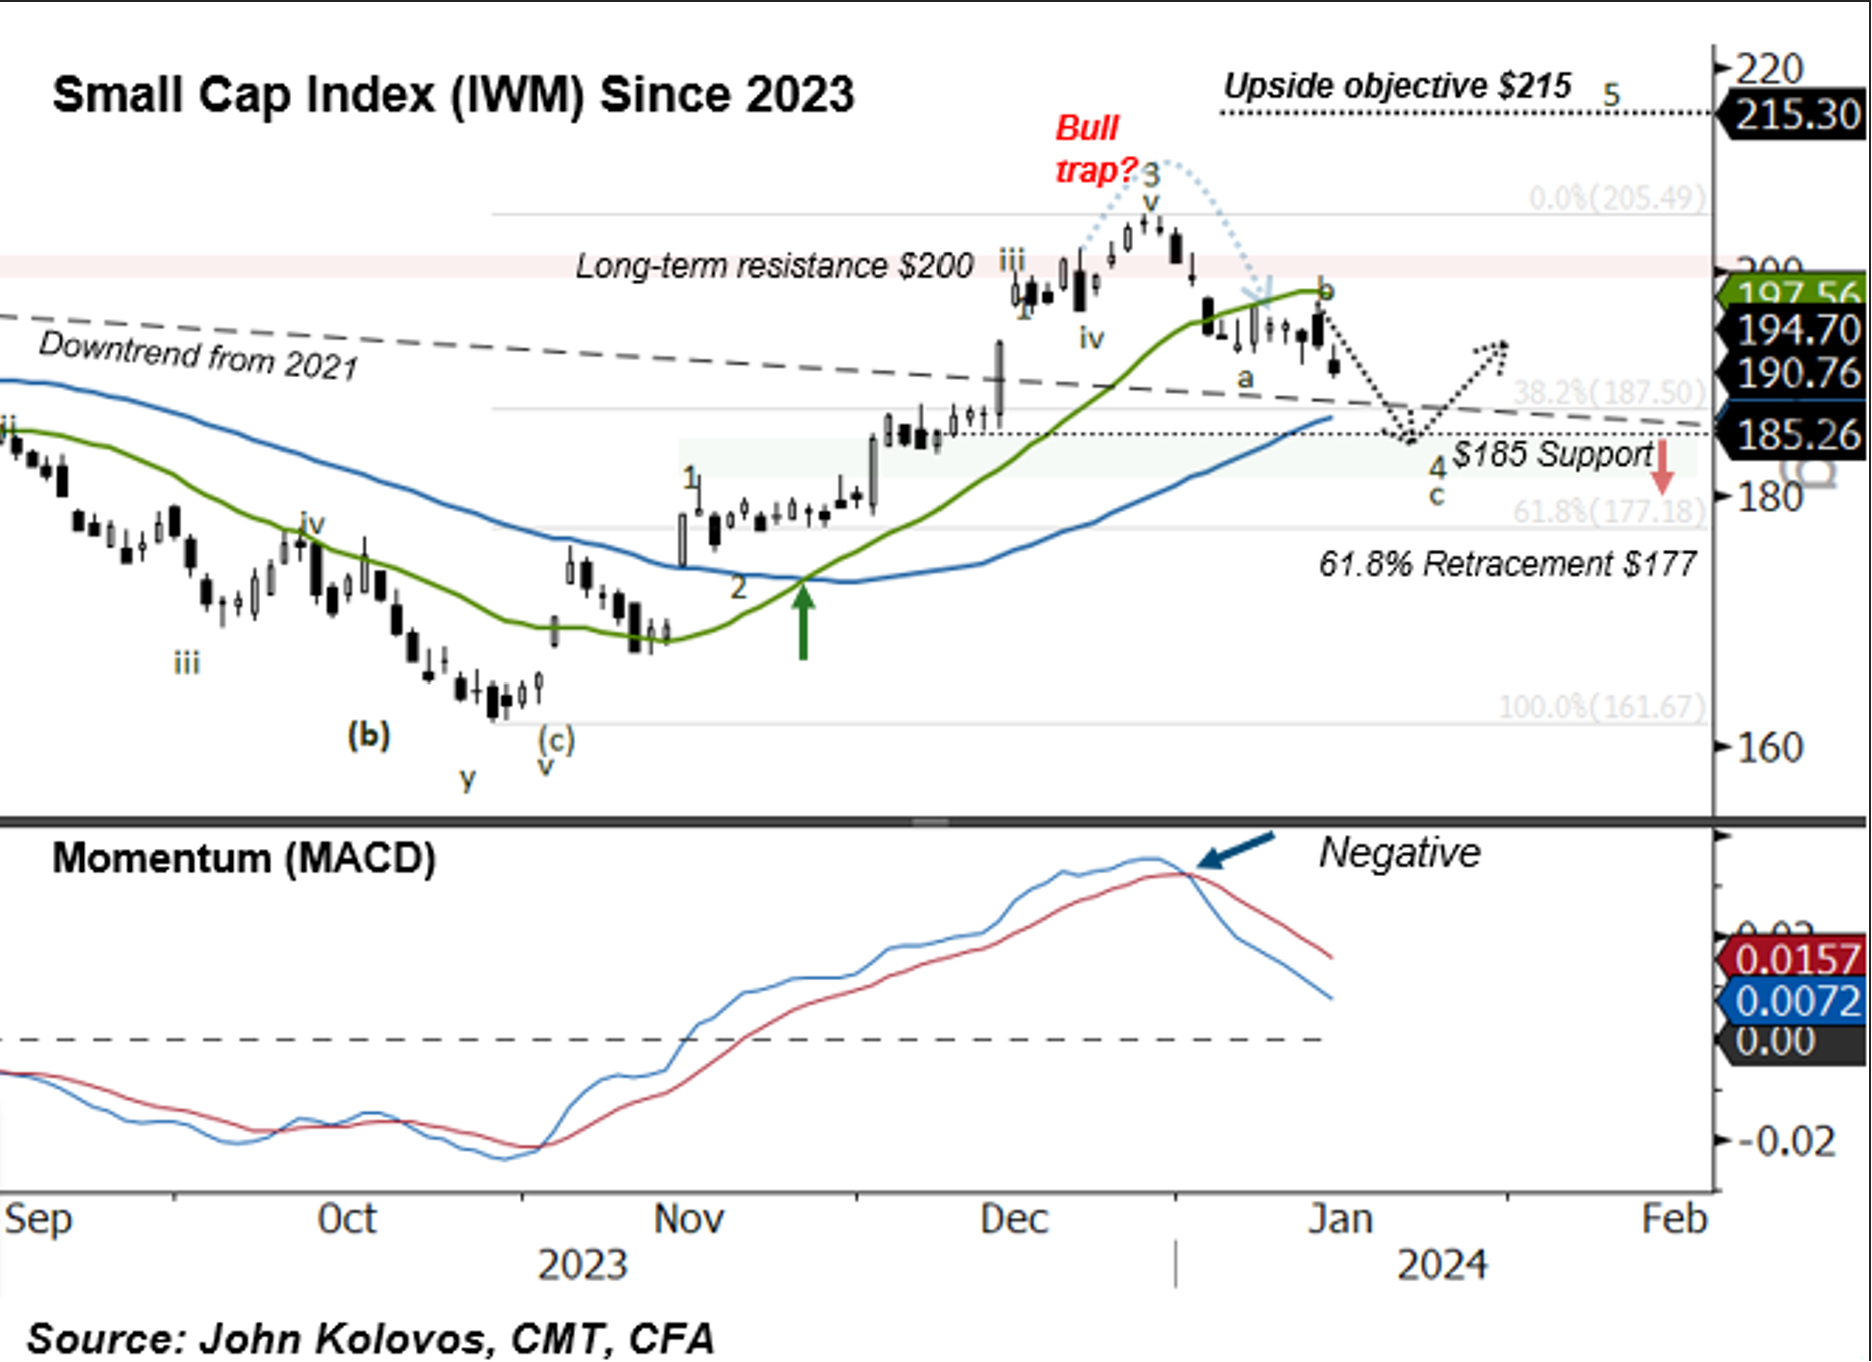
Parabolic Moves Do Not Correct Sideways |
Courtesy of John Kolovos, CMT, CFA & Bloomberg |
The tricky part since the beginning of the year has been navigating the consolidation phase. Outside of Small Caps, most stocks are consolidating sideways through time and not meaningfully lower via price. The risk, however, is that we are about to commence on a sharp retracement of the October recovery, which is supported by overly bullish sentiment, market cycles, and the 1999 analog, which suggests a proper correction into February, is following that script nearly perfectly. To that end, a deeper retracement will be signaled on a break of 4700, which will open the doors for a move not only to 4600 but a 1/3 retracement to the 4500 area. |
|
|
A Counter-Trend Bounce for the 10-Year Yield |
Courtesy of John Kolovos, CMT, CFA & Bloomberg |
One of Bob Farrell’s trading rules states, "Exponential rapidly rising or falling markets usually go further than you think, but they do not correct by going sideways.” The Q4 rally in stocks was an example, especially the 27% gain in small caps over trading 40 days. Therefore, a sideways pause is unlikely. We have been of the view that a pullback to the $185/$190 area would be consistent with a healthy pullback on IWM. In January, trading evolved into a classic ABC type of decline, which tracks to $185 and is approximately where the 50 DMA resides (see chart 4). So long as said support holds, one can continue to look higher, potentially as high as $215, before a prolonged shakeout occurs. Otherwise, $177 or a 61.8% retracement is likely unfolding. |
| |
A Steeper Yield Curve is Weighing on Risk Sentiment |
Courtesy of John Kolovos, CMT, CFA & Bloomberg |
With the 10-year moving higher, we have the 2/10 curve at the steepest level since Halloween. A key technical theme of ours this year is whether the "momentum buy" signal on the monthly charts will lead to the curve turning positive and the impact it will have on risk sentiment. Turning the curve positive has led to higher stock values looking out one year later, but the degree to which it steepens becomes problematic. In the past, 40bps or more have been associated with equity market corrections/bear markets and a recession. We are nowhere near that, but folks are starting to alter positioning. |
| |
Recent Sector Correlations to Yield Curve |
Courtesy of John Kolovos, CMT, CFA & Bloomberg |
Recent correlations suggest that a steeper curve should act as a headwind for Small Caps and the average stocks (RSP), Industrials, Real Estate, Materials, and Utilities while favoring Communication, Large Caps, Software, and Growth. So, while the S&P 500 is currently consolidating sideways through time, the macro environment is back to weighing on the market of stocks. |
| |
John Kolovos, CFA, CMT is Head of Technical Strategy at Macro Risk Advisors. In this role, John is responsible for delivering high-conviction investment insights for institutional cleints, identifying tactical trading opportunities, and analyzing cross-asset relationships between stocks, commodities, currencies, and interest rates from across the globe. John has been one of Wall Street’s most sought-after macro-based analysts for over 20 years, and is a frequent guest on CNBC and Bloomberg TV and is widely quoted in the financial press. John is also an adjunct professor at Brandies University, where he teaches a graduate-level course on Technical Analysis and is very active in the technical analysis community by serving on the executive committee as Vice-President for the Charted Market Technicians Association (CMT) as well as sitting on the Governance committee. |
|
|
You are receiving this newsletter because you subscribed to the Chart Advisor newsletter. If you wish to unsubscribe, please click here. Dotdash Meredith 225 Liberty St, 4th Floor, New York, NY 10281
© 2025 All Rights Reserved. Privacy Policy | Terms of Service |
|
|
|