
About
Almanac Trader
I am the editor of the Stock Trader's Almanac & Almanac Investor Newsletter. I use historical patterns and market seasonality in conjunction with fundamental and technical analysis...
+ FOLLOW THIS TUMBLR
Election-Year January Tracking Historical Seasonal Pattern
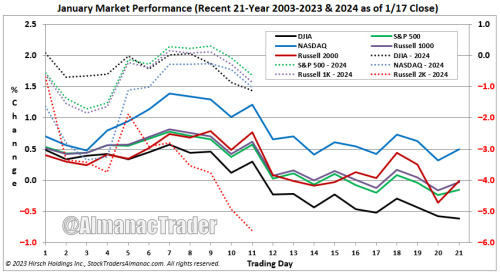
Earlier this month we noted that election-year Januarys have historically been soft and that since around the year 2000, January’s prowess has faded. As of today’s close, DJIA, S&P 500, NASDAQ, Russell 1000, and Russell 2000 are all negative year-to-date. Except for Russell 2000, down 5.62% thus far in January, losses have been relatively mild ranging from 0.64% from S&P 500 to 1.12% by DJIA.
In the chart above, the recent 21-year seasonal pattern for January has been plotted and uses the left vertical axis. Year-to-date 2024 is using the right vertical axis. Comparing this year to the averages over the last 21 years, this year has been slightly weaker than average while generally tracking the overall pattern with early weakness followed by some strength. From around now until the end of the month, the historical pattern suggests more choppy trading is likely.