
About
Almanac Trader
I am the editor of the Stock Trader's Almanac & Almanac Investor Newsletter. I use historical patterns and market seasonality in conjunction with fundamental and technical analysis...
+ FOLLOW THIS TUMBLR
Tech Selloff Sets Up NASDAQ’s Midyear Rally
The week after June Triple Witching delivered its expected weakness, but this sets up NASDAQ’s 12-day midyear rally to a T.
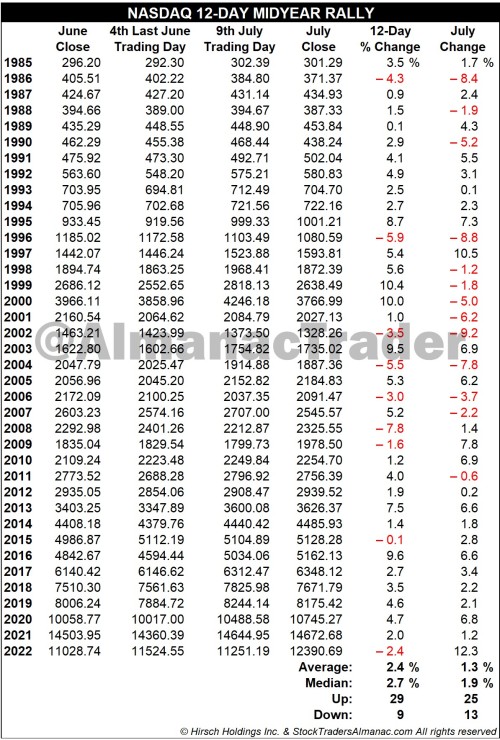
In the mid-1980s tech’s influence in the market began to grow and the market’s focus in early summer shifted to the outlook for second quarter earnings of technology companies. In anticipation of positive results, over the last three trading days of June and the first nine trading days in July, NASDAQ typically enjoys a rally. This 12-day run has been up 29 of the past 38 years with an average historical gain of 2.4%. Look for this rally to begin around June 28 and run until about July 14.
After the bursting of the tech bubble in 2000, NASDAQ’s mid-year rally had a spotty track record from 2002 until 2009 with three appearances and five no-shows in those years. However, it has been quite solid over the last thirteen years, up eleven times with two losses. Last year, NASDAQ faltered during the 12-day span, but eventually took off in the second half of July, up 12.3%.
Our strategy is to buy the close on Tuesday June 27 and sell July 14 or take profits on any sizable gain in between.
 hnycups-blog liked this
  kingofpig liked this
  psychostudnia liked this
  haus-of-commons liked this
  hopefulnuttastemaker liked this
  leftsoulbageldiplomat liked this
  jeffhirsch posted this