
About
Almanac Trader
I am the editor of the Stock Trader's Almanac & Almanac Investor Newsletter. I use historical patterns and market seasonality in conjunction with fundamental and technical analysis...
+ FOLLOW THIS TUMBLR
When Bullish April Is Down Stocks Often Struggle Until Q4
April was the first down month in 6 months. Almanac readers know April is the best Dow month by average percent change and #2 for S&P. It’s ranked fourth for average percent change on NASDAQ and Russell 2000.
In general, April is a notoriously bullish market month overall with a high average percent and plurality of gains across the board. A negative April is cause for concern. When the #1 Dow month is down that could be significant.
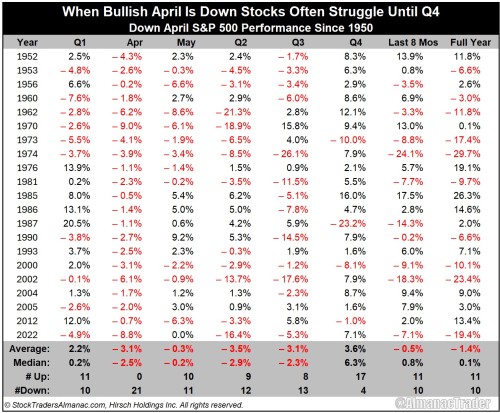
Digging into the data in the tables below of all down Aprils since 1950 there is a plethora of red in May and through Q2 and Q3. There are several steep drops scattered throughout these 21 down April years. May, Q2 and Q3 show consistent and average losses.
Q4 however delivered solid gains except for four years: 1973 (Watergate, Vietnam, Oil Embargo), 1987 (Crash), 2000 (Undecided Election) and 2012 (ZIRP, QE3, Operation Twist, Big Q1 & Q3). You can see why we expect the market to struggle for the next several months.