Key Points:
1- The SPX comes into the last week of the year’s second quarter +4% for June, +5.8% for the quarter and +13.3% YTD and could log its third straight +5% quarter.
2- The key now is understanding the vital changes that have taken place to get us here and what needs to happen to keep it going. We discuss three of the most important ones below.
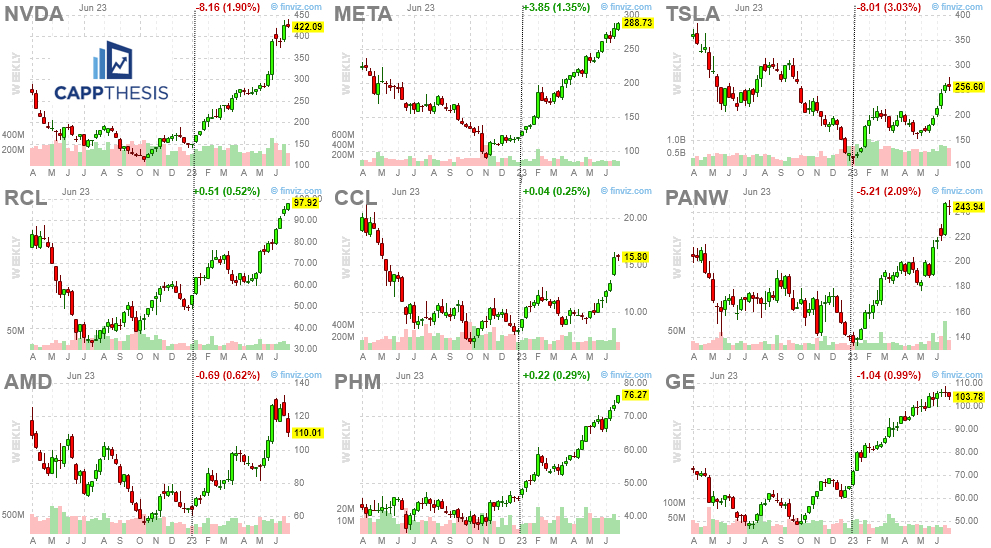
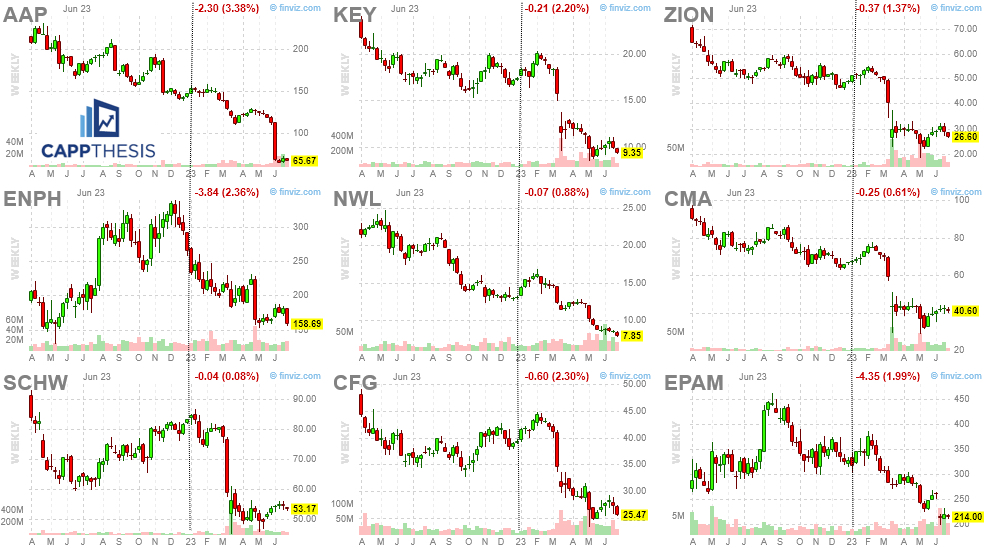
3- The best and worst nine SPX stocks YTD appear below. The most glaring takeaway is that it’s nine uptrends vs. nine downtrends. Most of said trends began before 2023.
Topics Covered:
-Performance YTD, Qtr, Month
-+5% quarterly streaks
-S&P 500 Stocks – Best & Worst
-SPX Patterns
-Drawdowns
-Key Support
-SPY Anchored VWAP
-Gold & Silver
SPX:
The SPX comes into the last week of the year’s second quarter +4% for June, +5.8% for the quarter and +13.3% YTD.

This being the case, the SPX has a chance to log its third straight +5% quarter, which we haven’t had since…well, not too long ago. From the second quarter of 2020 through the second quarter of 2021, the SPX logged FIVE straight 5% quarterly gains.

Can the market keep up this pace?
That’s been the question since a few days after the October’22 lows. The groans only have grown stronger since the March’23 lows, as behemoth tech names have taken the reigns.
While it would be “easy” to pound one’s chest and declare it’s either a bull market or the mother of all bear market rallies, that wouldn’t help.
The key is understanding the vital changes that have taken place to get us here and what needs to happen to keep it going.
We’ve touched on a handful of these as things have progressed. The three most important ones for the SPX are that:
1-Bullish patterns are working. Bearish patterns are not.
2-The frequency of big moves have considerably dropped.
3-The number of big GAINS noticeably outnumber the number of big DECLINES.
There are others, but without these three variables, everything else wouldn’t have taken place – like the SPX busting through its key moving averages and said moving averages turning higher, etc.
The bottom line is that these three points simply were not present in 2022, and the market floundered.
S&P 500 Stocks – YTD Leaders & Laggards
As we know, the “average” stock doesn’t look like the S&P 500.
The equal weight RSP S&P 500 ETF is:
June: +3.7%
2Q: +0.10%
YTD: +2.6%
Yes, we get a false sense of what’s happening if we ignore this. But no matter what stocks are leading – huge or tiny – it’s up to traders to stay aligned with the names showing solid relative strength.
That’s easier said than done, but if one thing has become clear this year, it’s that trends trend. We profile the performance differences every week in the PostScript report – and more often than not, the weekly laggards have been the YTD laggards – both from an ETF and single stock perspective.
Here are the best and worst nine SPX (and RSP) stocks. The most glaring takeaway is that it’s nine uptrends vs. nine downtrends. Most of said trends began before 2023.
YTD Leaders
YTD Laggards
SPX Patterns
All of that has combined to produce bullish patterns for the SPX, with the last one still in play now. Target 4,540.
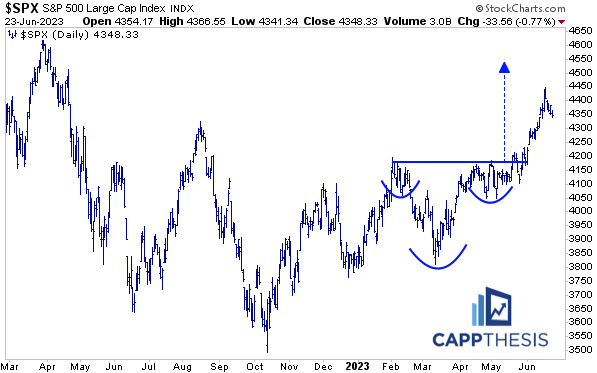
The potential for the recent pullback to be another short-term continuation pattern remains a possibility.
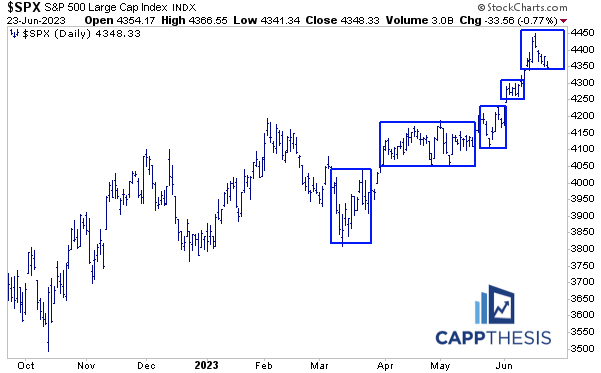
The current drawdown still is quite small and in line with the “biggest” pullbacks we’ve seen since the March lows.

Should the sell-off worsen, the uptrend line from the March lows could be in play, which extends to about 4,240.

SPY AVWAP
For now, SPY remains below the 6/15 high Anchored VWAP, which is near 437 – short-term resistance.

Pre-Market
Commodities are up across the board with the Dollar lower.
We’ve profiled GDX Gold Miners are few times recently, and for it to materially bounce, it clearly needs Gold to do the same. Both Gold and Silver are testing key multi-month uptrend lines, which both have bounced strongly from before.


